Data Analytics Techniques
1. what is Data Analytics Techniques?
Data Analytics Techniques refer to the various methods used to analyze data and extract meaningful insights that can support decision-making, solve problems, and predict future trends. These techniques are used across multiple industries, including business, healthcare, finance, and marketing, to analyze large datasets and identify patterns, correlations, and trends that may not be immediately apparent. Depending on the goal of the analysis, different techniques are applied, ranging from basic descriptive statistics to advanced machine learning and artificial intelligence methods.
One of the most common data analytics techniques is Descriptive Analytics, which focuses on summarizing historical data to understand what has happened in the past. This includes techniques like mean, median, mode, standard deviation, and frequency distributions, which help describe trends and patterns. For example, a business may use descriptive analytics to analyze past sales data to identify trends, seasonality, and performance in different regions. Visualizations like bar charts, histograms, and pie charts are often used in this phase to make the data easier to understand for non-technical stakeholders.
Another key technique is Diagnostic Analytics, which goes a step further to understand why certain events happened. This type of analysis often uses methods such as correlation analysis, regression analysis, and hypothesis testing to identify relationships and causality between variables. For example, a retailer might use diagnostic analytics to understand why sales dropped in a particular quarter by analyzing factors like pricing changes, competitor actions, or shifts in customer behavior. By identifying the root causes of problems, diagnostic analytics can help businesses make informed decisions to prevent future issues.
2.Descriptive Analytics
Descriptive Analytics
is a data analysis technique that focuses on summarizing and interpreting historical data to understand what has happened in the past. It is often considered the simplest form of analytics and serves as the foundation for more advanced types of analysis like diagnostic, predictive, and prescriptive analytics. The goal of descriptive analytics is to gain insights from past data to identify patterns, trends, and relationships, which can then inform future decision-making.
In Descriptive Analytics, the primary techniques used are basic statistical measures such as mean, median, mode, standard deviation, and variance, which provide a summary of the data. For example, a company may use descriptive analytics to calculate the average sales per month or the median customer age in a particular region. These metrics help businesses understand central tendencies in their data and identify general trends.
Additionally, data visualization plays a crucial role in descriptive analytics. Visual tools like bar charts, pie charts, line graphs, histograms, and heat maps are often used to represent and present data in an easily understandable format. These visuals help to convey trends, outliers, and patterns that may not be immediately apparent in raw datasets. For instance, a company might use a line graph to visualize sales growth over the last year or a bar chart to compare performance across different product categories.
3.Predictive Analytics
Predictive Analytics
is a data analysis technique that uses statistical models, machine learning algorithms, and historical data to forecast future outcomes or trends. Unlike descriptive analytics, which focuses on understanding past data, predictive analytics aims to predict what will happen in the future based on patterns observed in historical data. This type of analytics is widely used in various industries, including healthcare, finance, marketing, and retail, to make informed decisions, optimize operations, and reduce risks.
The core of predictive analytics lies in the use of advanced statistical models and machine learning algorithms. Some of the most common techniques include linear regression, decision trees, random forests, support vector machines, and neural networks. These models analyze historical data to find relationships between variables and use those patterns to make predictions about future events. For example, a financial institution might use predictive analytics to assess the likelihood of a customer defaulting on a loan by analyzing past credit behaviors, payment history, and other demographic factors.
A key advantage of predictive analytics is its ability to handle large and complex datasets, making it possible to identify trends and correlations that might otherwise be difficult to detect. This enables businesses to anticipate future events, such as customer behavior, market trends, or equipment failures, and take proactive measures. For example, in marketing, businesses use predictive models to forecast customer preferences and tailor their campaigns to target specific segments with the most relevant products or services. Similarly, in retail, predictive analytics can help optimize inventory management by forecasting demand for products based on past sales data, seasonality, and external factors.
4.Prescriptive Analytics
Prescriptive Analytics
is an advanced data analysis technique that goes beyond understanding and predicting what has happened or what will happen in the future. It focuses on providing actionable recommendations or solutions to optimize outcomes and make better decisions. The goal of prescriptive analytics is not just to forecast future events, but to suggest the best possible course of action based on the insights derived from data. It combines data, mathematical models, algorithms, and optimization techniques to answer the critical question: "What should we do?"
Prescriptive analytics involves a range of techniques, such as optimization algorithms, simulation models, and decision analysis, to evaluate different possible scenarios and recommend the most effective solutions. For example, in supply chain management, prescriptive analytics might recommend the most efficient routes for delivery trucks based on traffic data, weather conditions, and inventory levels. Similarly, in marketing, prescriptive models can help determine the best pricing strategy, promotional campaigns, or product placements to maximize revenue or customer engagement.
One of the primary tools used in prescriptive analytics is optimization, which aims to find the best solution from a set of possible choices by maximizing or minimizing a particular objective. For example, in manufacturing, prescriptive analytics can determine the optimal production schedule that minimizes costs while meeting demand. In finance, it can help optimize investment portfolios by balancing risk and return. Simulation modeling is also commonly used, where multiple scenarios are tested to see how different variables affect the outcome, allowing organizations to make decisions under uncertainty. Machine learning and artificial intelligence techniques are often integrated into prescriptive analytics to continuously improve recommendations by learning from new data and adjusting predictions accordingly.
5.Real-time Analytics
Real-time Analytics
refers to the process of continuously collecting, processing, and analyzing data as it is generated, allowing organizations to make immediate decisions based on up-to-the-minute information. Unlike traditional analytics, which may involve analyzing data in batches over time, real-time analytics enables the immediate processing and interpretation of data, making it highly valuable in situations where quick actions are required. This type of analytics is particularly useful in environments where timely decision-making is critical, such as in finance, e-commerce, healthcare, and manufacturing.
The core of real-time analytics lies in the ability to process and analyze streaming data. This data is typically generated continuously from various sources, including sensors, IoT devices, social media, financial transactions, and more. Technologies like Apache Kafka, Apache Flink, and AWS Kinesis enable the ingestion and processing of large volumes of data in real-time. For example, in a stock trading system, real-time analytics can process live market data and execute trades within milliseconds to capitalize on fluctuations in stock prices. Similarly, in e-commerce, real-time analytics can track customer behavior and personalize recommendations instantly, improving customer satisfaction and conversion rates.
Real-time analytics also relies heavily on the use of dashboards and visualization tools that present data insights in an easy-to-understand format. These tools help decision-makers quickly grasp key metrics, trends, and anomalies, enabling them to take immediate action. For example, in a manufacturing plant, real-time monitoring systems can track machine performance and detect equipment malfunctions. If an issue is detected, the system can trigger automated maintenance requests, minimizing downtime and improving operational efficiency. Similarly, in healthcare, real-time monitoring systems can track a patient's vital signs and alert medical professionals to any significant changes, facilitating faster intervention.
6.Sentiment Analysis
Sentiment Analysis
is a branch of natural language processing (NLP) and machine learning that focuses on determining the emotional tone behind a body of text. It is often used to understand the opinions, attitudes, and emotions expressed by people in online content such as social media posts, reviews, comments, or surveys. The goal of sentiment analysis is to classify text into categories such as positive, negative, or neutral, and in some cases, to assign a more granular sentiment, like joy, anger, or sadness.
The process of sentiment analysis typically involves several key steps. First, text preprocessing is done, which includes removing unnecessary elements such as stop words, punctuation, and special characters. After that, techniques such as tokenization (splitting text into smaller chunks like words or phrases) and stemming (reducing words to their root form) are applied to prepare the data for analysis. Then, machine learning algorithms or pre-built models like VADER (Valence Aware Dictionary and sEntiment Reasoner) or TextBlob are used to analyze the sentiment in the text. These models are trained on large datasets of labeled text (with known sentiment) and use this training to predict the sentiment of new, unseen text.
Sentiment analysis has a wide range of applications across industries. In business and marketing, companies use sentiment analysis to understand customer feedback, gauge brand perception, and improve their products or services. For example, by analyzing customer reviews or social media mentions, businesses can identify common issues or positive features that consumers associate with their products. Political analysts use sentiment analysis to gauge public opinion and predict election outcomes by analyzing social media posts and news articles. In finance, it is used to assess the sentiment of news articles, financial reports, or social media discussions to predict market movements or make investment decisions. Additionally, sentiment analysis is useful in customer support, helping organizations automatically categorize and prioritize customer queries based on the sentiment expressed, ensuring that negative experiences are addressed promptly.
7.Text Analytics
Text Analytics
Text Analytics is the process of extracting meaningful insights and information from unstructured text data. It involves the use of natural language processing (NLP), machine learning, and statistical techniques to analyze and understand large volumes of textual data. Text analytics is used to transform raw text into structured data that can be analyzed for trends, patterns, and actionable insights. This technique is crucial in an era where most data, such as customer reviews, social media posts, emails, and documents, exists in unstructured formats.
Text analytics typically involves several key steps. Text preprocessing is the first step, where irrelevant data such as stop words (common words like "and", "the", "is") and special characters are removed. The text is then tokenized (broken into smaller units like words or phrases), and stemming or lemmatization is applied to reduce words to their base forms (e.g., "running" becomes "run"). Once the text is preprocessed, techniques like sentiment analysis, topic modeling, or named entity recognition (NER) are used to extract meaningful patterns. Sentiment analysis, for example, assesses the emotional tone behind text, while topic modeling identifies the underlying themes within a collection of documents. Clustering and classification methods can also be applied to group similar text data or categorize it into predefined categories.
The applications of text analytics are vast and span many industries. In business, text analytics helps companies analyze customer feedback, reviews, and social media to understand customer sentiment, identify trends, and enhance customer experience. In marketing, businesses use text analytics to track brand perception, monitor customer satisfaction, and create targeted advertising campaigns. In healthcare, text analytics is used to analyze patient records, medical literature, and clinical notes to gain insights into treatment outcomes or identify emerging health trends. Legal firms and financial institutions use text analytics to process large volumes of legal documents or financial reports, extracting critical information for compliance, risk management, and decision-making.
8.Image & Video Analytics
Image & Video Analytics refers to the use of computer vision, machine learning, and artificial intelligence (AI) to analyze and interpret visual data such as images and videos. These technologies enable machines to automatically process, understand, and derive insights from visual content, much like humans do. Image and video analytics are widely used across various industries to automate tasks, improve efficiency, and enhance decision-making by extracting relevant information from visual media.
In image analytics, the focus is on analyzing individual images to extract features such as objects, patterns, faces, or text. This process involves tasks like object detection, image classification, image segmentation, and feature extraction. For example, in healthcare, image analytics is used to analyze medical images, such as X-rays or MRIs, to detect abnormalities like tumors or fractures. In retail, it is used to analyze images of store shelves to monitor inventory and identify out-of-stock items. Facial recognition is another popular application, used in security systems to identify individuals based on facial features. Optical Character Recognition (OCR) is used to extract text from images, enabling document scanning and automation.
Video analytics goes a step further by analyzing sequences of images in videos to detect patterns, behaviors, and events over time. It involves techniques such as motion detection, activity recognition, scene analysis, and tracking. For instance, in security, video analytics can be used to monitor surveillance footage in real time, detecting suspicious activities, tracking people or vehicles, and triggering alarms if necessary. In sports, video analytics is used to track player movements, analyze game strategies, and generate insights for performance improvement. In autonomous vehicles, video analytics helps process live video feeds from cameras to identify obstacles, recognize traffic signs, and support driving decisions in real time.
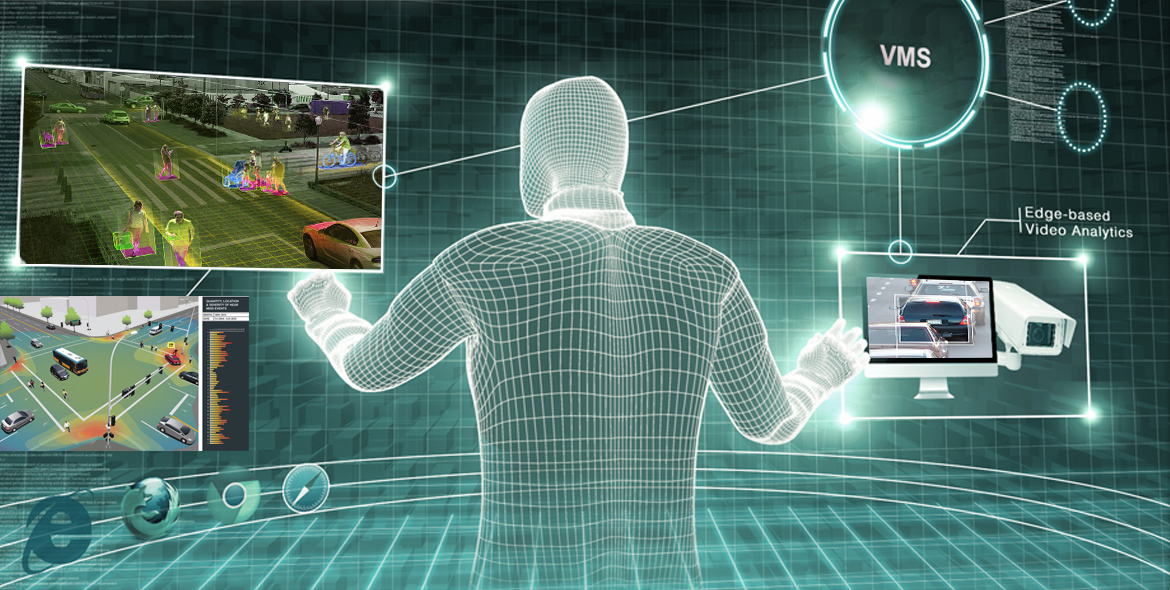
Comments